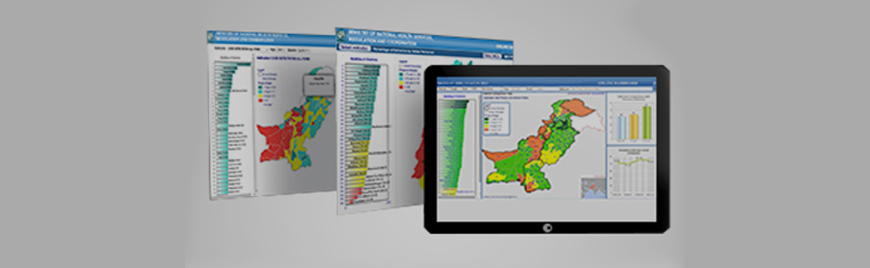
This project measure the performance of 16 targets and 41 indicators against which progress towards Eight Goals of the MDG’s are measured. You may select areas, years, goals, and indicators form drop down menus and then click on different parts of the map to see the dashboards functionality in the left panels. The plotted map is open source and don't depend on any JavaScripts or Google maps API. The web portal takes boundaries from backend database and plots in HTML5 using Scalar Vector Graphics (SVG). Client events are also added in this map. PaceTech developed this project for Millennium Development Goals, United Nations Development Programme, Pakistan.
Pace Technologies has highly qualified and experience professionals with multi-disciplinary skills those provide their best services to meet client’s
 Health MIS
  Monitoring & Evaluation
  Analytical Dashboards
  Software Integration
  Mobile Apps Development
  WebGIS & Thematic Maps